[ Next Article |
Previous Article |
Book Contents |
Library Home |
Legal |
Search ]
Commands Reference, Volume 5
svmon Command
Purpose
Captures and analyzes a snapshot
of virtual memory.
Syntax
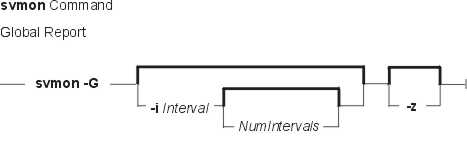
Global Report
svmon -G
[ -i Interval [ NumIntervals]]
[ -z ]
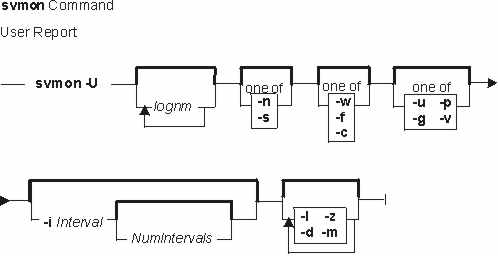
User Report
svmon -U [ lognm1...lognmN]
[ -n | -s ]
[ -w | -f |
-c ]
[ -t Count ]
[ -u |
-p |
-g |
-v ]
[ -i Interval [ NumIntervals]]
[ -l ]
[ -d ]
[ -z ]
[ -m ]
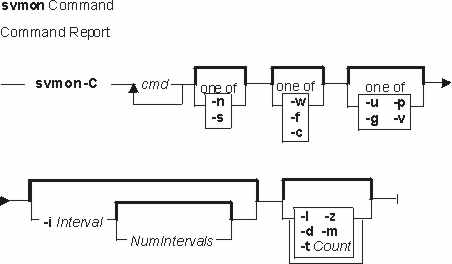
Command Report
svmon -C cmd1...cmdN
[ -n |
-s ]
[ -w |
-f |
-c ]
[-t Count ]
[ -u |
-p |
-g |
-v ]
[ -i Interval [ NumIntervals]]
[ -l ]
[ -d ]
[ -z ]
[ -m ]
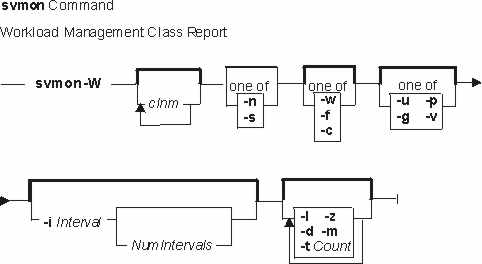
Workload Management Class Report
svmon -W [ clnm1...clnmN ]
[ -n |
-s ]
[ -w | -f |
-c ]
[-t Count ]
[ -u |
-p |
-g |
-v ] [ -i Interval
[ NumIntervals]]
[ -l ]
[ -d ]
[ -z ]
[ -m ]
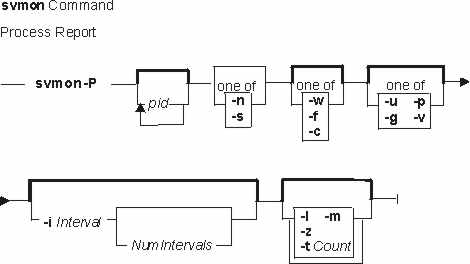
Process Report
svmon -P
[ pid1... pidN ]
[ -n |
-s ]
[ -w |
-f |
-c ]
[ -t Count ]
[ -u |
-p |
-g |
-v ]
[ -i Interval [ NumIntervals]]
[ -l ]
[ -z ]
[ -m ]
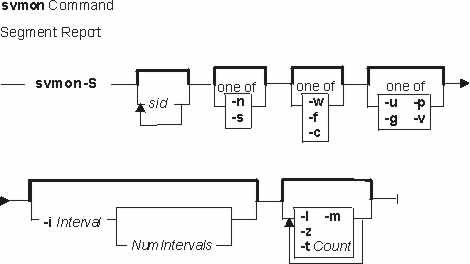
Segment Report
svmon -S [ sid1...sidN ]
[ -n |
-s ] [ -w |
-f |
-c ]
[ -t Count ]
[ -u |
-p |
-g |
-v ]
[ -i Interval [ NumIntervals]]
[ -l ] [ -z ]
[ -m ]
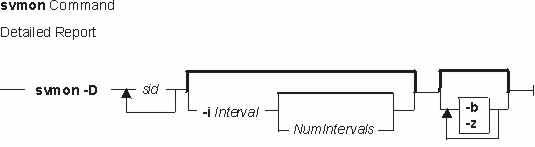
Detailed Report
svmon -D sid1..sidN
[ -b ]
[ -i Interval [ NumIntervals]]
[ -z ]
Description
The svmon command displays
information about the current state of memory. The displayed
information does not constitute a true snapshot of memory,
because the svmon command runs at user level with
interrupts enabled.
Reports
Reports
The svmon command creates seven types of reports:
Each report type is described here. Unless otherwise noted,
all statistics are in units of 4096-byte pages.
Global Report
The global report is printed when the -G flag is specified.
The column headings in a global report are:
- memory
- Specifies statistics describing the use of real memory, including:
- size
- Number of real memory frames (size of real memory)
Note: This includes any free frames that have been made unusable by the memory sizing
tool, the rmss command.
- inuse
- Number of frames containing pages
- free
- Number of frames free of all memory pools
- pin
- Number of frames containing pinned pages
- virtual
- Number of pages allocated in the system virtual space
- stolen
- Number of frames stolen by rmss and maked unusable by the VMM
- in use
- Specifies statistics on the subset of real memory in use, including:
- work
- Number of frames containing working segment pages
- pers
- Number of frames containing persistent segment pages
- clnt
- Number of frames containing client segment pages
- pin
- Specifies statistics on the subset of real memory containing pinned pages, including:
- work
- Number of frames containing working segment pinned pages
- pers
- Number of frames containing persistent segment pinned pages
- clnt
- Number of frames containing client segment pinned pages
- pg space
- Specifies statistics describing the use of paging space.
- size
- Size of paging space
- inuse
- Number of paging space pages used
Note: A frame is a 4K block of
real memory
User Report
The user report is printed when the -U flag is specified. The column headings in a user
login report are:
- User
- Indicates the user name
- Inuse
- Indicates the total number of pages in real memory in segments that are used by the user.
- Pin
- Indicates the total number of pages pinned in segments that are used by the user.
- Pgsp
- Indicates the total number of pages reserved or used on paging space by segments that are used
by the user.
- Virtual
- Indicates the total number of pages allocated in the process virtual space.
Once this columns heading is displayed, svmon displays
(if the -d flag is specified)
information about
all the processes run by the specified login user name. It only contains the column heading of the
processes as described in Process Report.
Then svmon displays information about the segments used by
those processes.
This set of segments is separated into three categories:
- The segments that are flagged system that are basically shared by all processes
- The segments that are only used by the set of processes
- The segments that are shared between several users
If -lflag is specified, then for each segment in the last category,
the list of process
identifiers that use the segment is displayed. Beside the process identifier, the login user name
that executes it is also displayed. See the -l flag description
for special segments processing.
Command Report
The command report is printed when the -C flag is specified. The column headings in a
command report are:
- Command
- Indicates the command name.
- Inuse
- Indicates the total number of pages in real memory in segments that are used by the command
(all process running the command).
- Pin
- Indicates the total number of pages pinned in segments that are used by the command
(all process running the command).
- Pgsp
- Indicates the total number of pages reserved or used on paging space by segments that are
used by the command.
- Virtual
- Indicates the total number of pages allocated in the virtual space of the command.
Once this columns heading is displayed, svmon displays (if the -d flag is specified)
information
about all the processes running the specified command. It only contains the column heading of the
processes as described in Process Report.
Then svmon displays information about the segments used by those processes. This set of
segments is separated into three categories:
- The segments that are flagged system that are basically shared by all processes.
- The segments that are only used by the set of processes
- The segments that are shared between several command names
If the -l flag is specified, then for each segment in the last category, the list of
process identifiers
that use the segment is displayed. Beside the process identifier, the command name it runs is also
displayed. See the -l flag description for special segments
processing.
Workload class Report
The workload class report is printed when the -W flag is specified. The column
headings in a workload class report are:
- Class
- Indicates the workload class name.
- Inuse
- Indicates the total number of pages in real memory in segments belonging to the workload class.
- Pin
- Indicates the total number of pages pinned in segments belonging to the workload class.
- Pgsp
- Indicates the total number of pages reserved or used on paging space by segments belonging to the
workload class.
- Virtual
- Indicates the total number of pages allocated in the virtual space of the workload class.
Once this columns heading is displayed,svmon displays information about the segments belonging to the
workload class.
If -l option is specified, then for each segment, the list of process identifiers that use the
segment is displayed. Beside the process identifier, the workload class the process belongs to is also
displayed. See also -l flag description for special segments processing.
Note: a process belongs to the workload class, if its initial thread belongs to it.
Process Report
The process report is printed when the -P flag is specified. The column headings in a
process report are:
- Pid
- Indicates the process ID.
- Command
- Indicates the command the process is running.
- Inuse
- Indicates the total number of pages in real memory in segments that are used by the process.
- Pin
- Indicates the total number of pages pinned in segments that are used by the process.
- Pgsp
- Indicates the total number of pages reserved or used on paging space by segments that are used
by the process.
- Virtual
- Indicates the total number of pages allocated in the process virtual space.
- 64-bit
- Indicates if the process is a 64 bit process (Y) or a 32 bit process (N
- Mthrd
- Indicates if the process is multi-threaded (Y) or not (N)
Once process information are displayed, svmon displays information about all the segments
the process uses. Information about segment are described in the paragraph Segment Report
Segment Report
The segment report is printed when the -S flag is specified. The column headings in a
segment report are:
- Vsid
- Indicates the virtual segment ID. Identifies a uniq segment in the VMM.
- Esid
- Indicates the effective segment ID. When provided, it indicates how the segment is used by the process.
If the vsid segment is mapped by several processes but with different esid values then this field contains '-'.
In that case, the exact esid values can be obtained through -P option applied on each process identifiers using the
segment.
- Type
- Identifies the type of the segment: pers indicates a persistent segment, work indicates a
working segment, clnt indicates a client segment, map indicates a mapped segment and rmap indicates a
real memory mapping segment.
- Description
- Specifies a textual description of the segment. The value of this column depends on
the segment type. If the segment is a persistent segment and is not associated with a log, then the
device name and i-node number of the associated file are displayed, separated by a colon. (The device
name and i-node can be translated into a file name with the ncheck command.) If the segment is the
primary segment of a large file, then the words large file are prepended to the description.
If the segment is a persistent segment and is associated with a log, then the string
log is displayed. If the segment is a working segment, then the svmon command attempts to
determine
the role of the segment. For instance, special working segments such as the kernel and shared library
are recognized by the svmon command. If the segment is the private data segment for a process,
then
private is printed out. If the segment is the code segment for a process, and the segment report is
printed out in response to the -P flag, then the word code is prepended to the description.
If the segment is mapped by several processes and used in a different way
(for example, a process private segment mapped as shared memory by an other process),
then the description is empty. The exact description can be obtained through -Pflag
applied on each process identifier using the segment.
If a segment description is too large to fit in the description space then the description is
truncated. The truncated part can be obtained through the -S flag (without -l) on
given segment.
- Inuse
- Indicates the number of pages in real memory in this segment.
- Pin
- Indicates the number of pages pinned in this segment.
- Pgsp
- Indicates the number of pages used on paging space by this segment. This field is relevant only
for working segments.
- Virtual
- Indicates the number of pages allocated for the virtual space of the segment.
(Only for working segments).
Note: VMM manages this value for statistics purpose. It may happened it is not
updated. Then its value may be less than the inuse counters.
- Address Range
- Specifies the range(s) within the segment pages have been allocated. Working segment
may have two ranges because pages are allocated by starting from both ends and moving towards
the middle.
If the -l flag is present, the list of process identifiers that use that segment is
displayed. See the -l flag description for special segments
processing.
Detailed Report
The detailed report is printed when the -D flag is specified. The column headings in a
detailed report are:
Same segment information as described in the segment report
and it prints for each frame:
- Page
- Relative page number to the virtual space. This page number can be higher than the number of frame in a segment (65532)
in the virtual space is larger than a single segment (large file).
- Frame
- Frame number in the real memory
- Pin
- Indicates if the frame is pinned or not
- Ref
- Indicates if the frame has been referenced by a process (-b option only).
- Mod
- Indicates if the frame has been modified by a process (-b option only).
Statistic values
A segment can be used by multiple processes. Each page from such a segment is accounted for
in the inuse, pin, virtual or pgspace fields for each process that uses the segment.
The total of the inuse, pin, virtual and pgspace fields over all active processes may exceed
the total number of pages in memory or on paging space.
VMM manages virtual counter for statistics purpose. It may happen if it is not updated.
Then its value may be less than the inuse counters.
Flags
If no command line flag is given, then the -G flag is implicit.
- -G
- Displays a global report.
- -P [ pid1... pidN]
- Displays memory usage statistics for process pid1...pidN. pid
is a decimal value.
If no list of process IDs (PIDs) is supplied memory
usage statistics are displayed for all active processes.
- -S [ sid1...sidN ]
- Displays memory-usage statistics for segments sid1...sidN. sid
is a hexadecimal value.
If no list of segment IDs (SIDs) is supplied memory usage statistics are displayed
for all defined segments.
- -U [ lognm1...lognmN ]
- Displays memory usage statistics for the login name lognm1...lognmN.
lognm is a string, it is an exact login name. If no list of login identifier
is supplied, memory usage statistics are displayed for all defined login identifiers.
- -C cmd1...cmdN
- Displays memory usage statistics for the processes running the command name
cmdnm1...cmdnmN. cmdnm is a string. It is the exact basename of
an executable file.
- -W [ clnm1...clnmN ]
- Displays memory usage statistics for the workload management class
clnm1...clnmN. clnm is a string. It is the exact name of a class.
If no list of class name is supplied, memory usage statistics are displayed for all
defined class names.
- -D sid1...sidN
- Displays memory-usage statistics for segments sid1...sidN,
and a detail status of all frames of each segment.
- -n
- Indicates that only non-system segments are to be included in the statistics.
By default all segments are analyzed.
- -s
- Indicates that only system segments are to be included in the statistics.
By default all segments are analyzed.
- -w
- Indicates that only working segments are to be included in the statistics.
By default all segments are analyzed.
- -f
- Indicates that only persistent segments (files) are to be included in the
statistics. By default all segments are analyzed.
- -c
- Indicates that only client segments are to be included in the statistics.
By default all segments are analyzed.
- -u
- Indicates that the objects to be printed are sorted in decreasing order by
the total number of pages in real memory. It is the default sorting criteria
if none of the following flags are present: -p, -g and -v.
- -p
- Indicates that the object to be printed are sorted in decreasing order by the
total number of pages pinned.
- -g
- Indicates that the object to be printed are sorted in decreasing order by the
total number of pages reserved or used on paging space. This flag in conjunction with
the segment report shifts the non-working segment at the end of the sorted list.
- -v
- Indicates that the object to be printed are sorted in decreasing order by the
total number of pages in virtual space. This flag in conjunction with the segment
report shifts the non-working segment at the end of the sorted list.
- -b
- Shows the status of the reference and modified bits of all the displayed frames
(detailed report -D). Once shown the reference bit of the frame is reset. When
used with the -i flag it detects which frames are accessed between
each interval.
Note: This flag should be used with caution because of its
performance impacts.
- -l
- Shows, for each displayed segment, the list of process identifiers that use the
segment and, according to the type of report, the entity name (login, command or class)
the process belong to. For special segments a label is displayed instead of the list of process
identifiers.
- System segment
- This label is displayed for segments that are flagged system
- Unused segment
- This label is displayed for segments that are not used by any existing processes.
- Shared library text
- This label is displayed for segments that contain text of shared library, and that may be used
by most of the processes (libc.a). This is to prevent the display of a long list of process.
- -z
- Displays the maximum memory size dynamically allocated (malloc) by svmon during
its execution.
- -m
- Displays information
about source segment rather than mapping segment when a segment is mapping a source
segment.
- -d
- Displays for a given entity, the memory statistics of the processes belonging to
the entity.
- -t Count
- Displays memory usage statistics for the top Count object to be printed
- -i Interval [ NumIntervals]
- Instructs the svmon command to print statistics out repetitively.
Statistics are collected and printed every Interval seconds. NumIntervals
is the number of repetitions; if not specified, svmon runs until user
interruption, Ctrl-C.
Notes:
- Because it may take a few seconds to collect statistics
for some options, the observed interval may be larger than the specified interval.
- If none of the -u, -p, -g, and -v flags are specified,
-u is implicit.
Security
Access Control: You must have
root authority to run this command.
Examples
- To print out global statistics, enter:
svmon -G
- To print out global statistics each minute during 1/2 hour, enter:
svmon -G -i 60 30
- To print out the memory usage statistics for the users root and steve
taking into account working segments, enter:
svmon -U root steve -w
- To print out the top 10 users of the paging space blocks, enter:
svmon -U -g -t 10
- To print out memory usage statistics for the commands oracle, xemacs and cc, enter:
svmon -C oracle xemacs cc
- To print out the memory usage statistics for the workload class default and
developer, enter:
svmon -W default developer
- To print out the memory usage statistics for processes 6746 and 10078 taking into
account working and persistent segments, enter:
svmon -P 6746 10078 -wf
- To print out the memory usage statistics of the top 10 process according to the
number of pinned pages, enter
svmon -P -t 10 -p
- To print out the memory usage statistics of all the process taking into
account non-system working segments and sorting the process by the number of virtual
pages, enter:
svmon -P -n -w -v
- To print out the memory usage statistic of segments e00e and 15015, result
sorted by the number of reserved paging space blocks, enter:
svmon -S e00e 15015 -g
- To print out the memory usage statistics of the top 5 working segment according to
the number of virtual pages , enter:
svmon -S -t 5 -w -v
- To sort system segments by the number of pages in real memory, and print out the top
10 system segments of the resulting list, enter:
svmon -S -s -u -t 10
- To print out the frames belonging to the segment e00e, enter:
svmon -D e00e
- To print out the frames belonging to the segment e00e with the status bit of each
frame, enter:
svmon -D e00e -b
Related Information
The ncheck command, rmss command.
Logical Volume Storage Overview, Paging Space Overview in AIX Version 4
System Management Guide: Operating System and Devices.
[ Next Article |
Previous Article |
Book Contents |
Library Home |
Legal |
Search ]